In March last year, I published an article looking at historical perspective on boom/bust cycles in SeekingAlpha. I suggested then that, “the (still) festering economic imbalances might get resolved along two alternative scenarios. Either we’ll have a full-blown deflationary depression that could see asset prices drop by 50% or more, or we’ll have a strong and sustained decline in the US Dollar, ” accompanied with a continued rise in equity markets. Today, the latter scenario appears more likely. Here’s why:
The bear-market scenario
Like the recent bull market, Japan’s 1980s bubble had been inflated by central bank monetary policies. After peaking in December 1989, that bubble popped sharply and suddenly, giving way to a 20-year bear market that saw the Nikkei decline 82%. Japan’s equity values are still more than 50% off their 1989 peaks.

Similar scenarios – not all equally dramatic – unfolded after the bursting of asset price bubbles in many other cases including the 1929 stock market crash. But other precedents suggest that asset prices could resume their ascent and the bubble might reflate to new extremes – even quite rapidly.
The bull market scenario
Last month, ostensibly in response to the Coronavirus scare, the U.S. Congress passed the “CARES Act” – the largest ever stimulus bill, more than double the size of the 2009 bailout package. In addition, the Federal Reserve announced five new facilities of its own: CPFF, MMLF, PMCCF, SMCCF and TALF, with the total monetary stimulus rising to $5 trillion. For perspective, that amounts to more than $15,000 per man, woman and child in the U.S. Most of this money, about $4.5 trillion will be injected into the capital markets.
With this stimulus, asset prices might reflate and vault high above their recent peaks. This is what happend in cases where governments and central banks responded to crises with unlimited monetary inflation. Historical examples include Zimbabwe, Venezuela, Argentina, Brazil, Israel and Germany. The following three charts show how such monetary inflation affects asset prices:


Perhaps most interesting of all is the chart related to the German 1922 Weimar inflation:
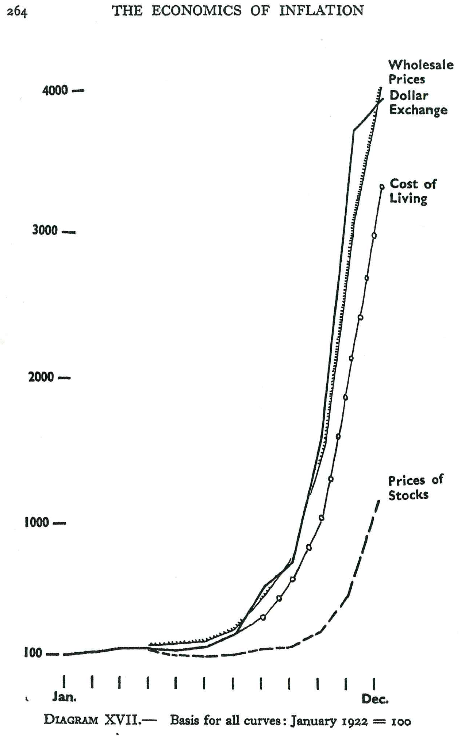
Source: prof. Costantino Bresciani-Turroni, “The Economics of Inflation – A Study of Currency Depreciation in Post War Germany” – 1931.
Which scenario is more likely today?
I believe that the inflation scenario is more likely. In my article, “The One Force Moving Stock Prices…” I provided empirical evidence central bank monetary inflation has by far the strongest impact on asset prices. The data, spanning ten boom-bust cycles in the U.S. is hard to argue with. I concluded my article as follows: “keeping the bubbles going is the only option, requiring an ever-expanding QE. This may have sealed the endgame: an accelerating bull run accompanied by hyperinflation after which comes an epic crash. I pray that I’m wrong.”
What to do?
I am not suggesting you go out and plough all your investable assets into equities. First, I could be wrong – the bear market is still a possibility. Secondly, the price trajectory may not be a straight line upward, and the rally, even if it materializes, might not take off immediately. Further price correction is possible. Rather than gambling on the timing of this or that outcome, I would encourage you to follow market trends.
On 13th February this year,just before the recent stock market crash, I published an article on SeekingAlpha: Bubbles Always Burst. But Forget Picking Out The Top. It’s Better To Use Systematic Trend Following To Navigate The Roller Coaster. With trend following you will never be buying at the bottom, nor selling at the top. As Bernard Baruch said it long ago, this simply cannot be done – except by liars. But trend following offers a number of very important benefits: (1) you don’t have to be right: if we go into a bear market, you’ll benefit by trading short (or going to cash); if the bubble begins to reflate, you’ll get the timely signals to go long; (2) trend following can impose discipline on your decision making, and (3) it will serve you as a valid guide to unpredictable market fluctuations for the long term.
Trend following also allows you to apply the same strategies to other markets like Silver, Gold, Oil, treasury futures and FX pairs. Diversification is the only free lunch in investing as it reduces your portfolio risk and enables you to capture value from trends even in markets you are less familiar with – trend following is equally applicable in just about any market. Here is how I-System trend following strategies performed through the recent market events:
With I-System through the storm – part 1 (covers Crude Oil, Silver and 30-yr Treasury Bond)
With I-System through the storm – part 2 (covers Russell 2000, S&P500 and Palladium)
These results were achieved simply through a disciplined adherence to a set of trend following strategies that take the guesswork out of the equation.
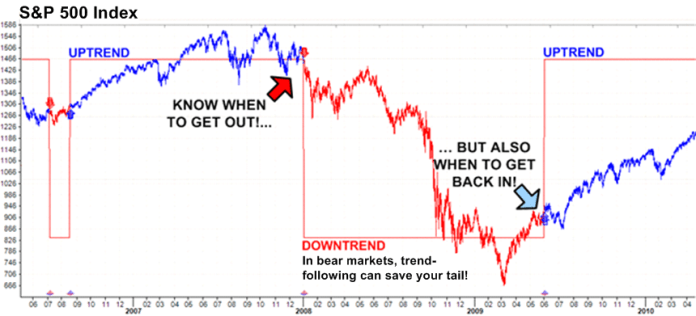
Screen-grab of a typical S&P500 strategy from the I-System’s interface shows up-trends in blue and downtrends in red. Onset of a down-trend is a signal to reduce or hedge your market exposure. It is equally important to know when to start adding to your exposure again. During the 2008 bear market, we achieved a 27% positive net return thanks to ISystem trend following strategies. The authenticity of these results was audited by KPMG.
TrendCompass offers reliable trend following guidance
TrendCompass provides daily trading signals based on I-System strategies that have proven reliable and effective for many years now. I created the I-System in 1999 and have used it in hedge fund management since 2007, consistently outperforming relevant strategy benchmarks including Dow Jones Credit Suisse index of Blue Chip managed futures funds – world’s top rated trend following funds.
I can propose several standard reports covering up to 140 financial and commodity markets. Subscription starts at 100 Euros per month and a free trial period is also offered. For more information, please contact me at xela.reniark@gmail.com or call me at +33 678 63 90 57.
Alex Krainer [xela.reniark@gmail.com] has traded financial and commodity futures and managed hedge funds for over 20 years. He wrote the 5-star rated book “Mastering Uncertainty in Commodities Trading”