
Asset price inflation might signal debasement of the currency and acceleration of commodity price inflation
This time it may well be different… For several years now, numerous high-profile commentators and analysts have been forecasting an imminent stock market correction, or indeed a crash, evoking the events of 1929, 1987, 2000 or 2008. Of course, many are now predicting it is sure to happen in 2018. If not, perhaps in 2019 or maybe 2020? Who knows… But so far, not many analysts – if any, apart from yours truly – have considered the possibility that this rally might extend even higher from today’s dizzying heights. In an October 2016 post I suggested that this is exactly what was ahead.
Namely, I suggested that the (still) festering economic imbalances would ultimately be resolved along two alternative scenarios. Either we’d have a full-blown recession or depression that might see asset prices drop by 50% or more, or we’d have a strong and sustained decline in the US Dollar. This second possibility could give rise to an accelerating and sustained inflation.
Historical precedents indicate that currency debasement could result in a continued rise in equity markets, as we saw most recently during the Zimbabwean and Venezuelan inflations, as well as the Argentinian, Brazilian, Israeli and German inflations before that. The following three charts illustrate this dynamic at work:


Perhaps most interesting of all is the chart related to the German 1922 Weimar inflation:
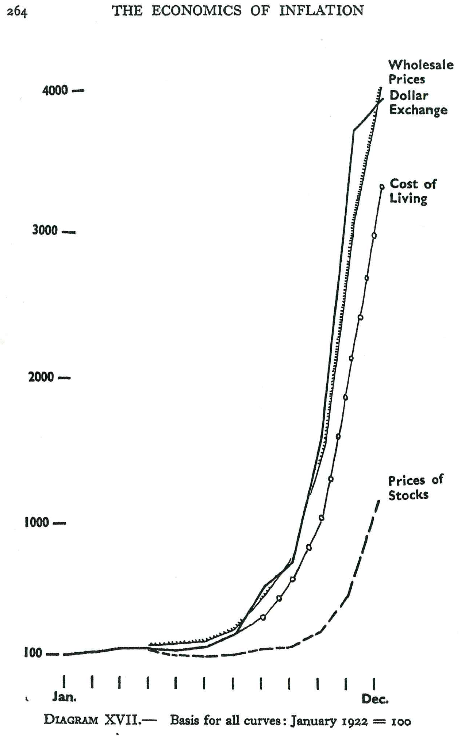
What the Weimar inflation chart shows is that in spite of the nearly vertical rise in equity prices, this rise was eclipsed by the skyrocketing costs of living and the collapse of the currency. This “readjustment” effectively destroyed most people’s savings and pensions.
While most inflation episodes aren’t this drastic, inflation risk is far greater than most people appreciate. Since 1960, more than two thirds of the world’s market economies suffered episodes of inflation that exceeded 25% in at least one year. On average, people lost 53% of purchasing power during such episodes. In some cases losses of wealth were much greater.
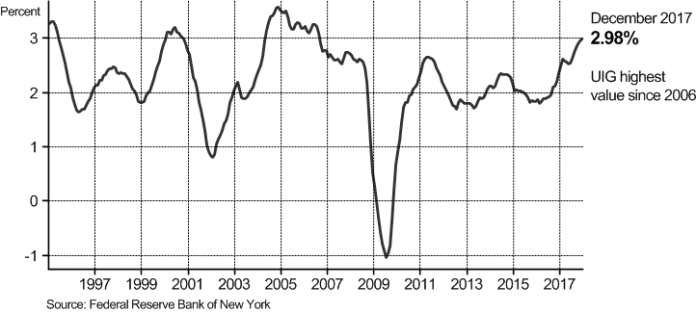
The idea that we could experience an onset of such an extended period of inflation has been gaining attention as more and more inflation-related aggregates seem to be heating up. Most recently, New York Fed’s “Underlying Inflation Gauge” (UIG), considered to be one of the most reliable indicators of cyclical turning points in inflation has broken sharply higher, reaching nearly 3%, highest level since 2006, as the following chart illustrates:
Without a doubt, the road ahead is bumpy and fraught with risk and dangers. Weimar inflation resulted in a depression that ultimately brought us to World War II. We should hope that we have learned some lessons from the tragedy that was the 20th century and that we’ll be able to find mechanisms of crisis resolution that don’t involve military conflicts and bloodshed.
